codebytes4u
Forum Expert
- Joined
- Aug 5, 2016
- Posts
- 1,113
- Reaction
- 28,195
- Points
- 3,680
ESP32 JTAG Debug November 2022
Size: 1.47GB
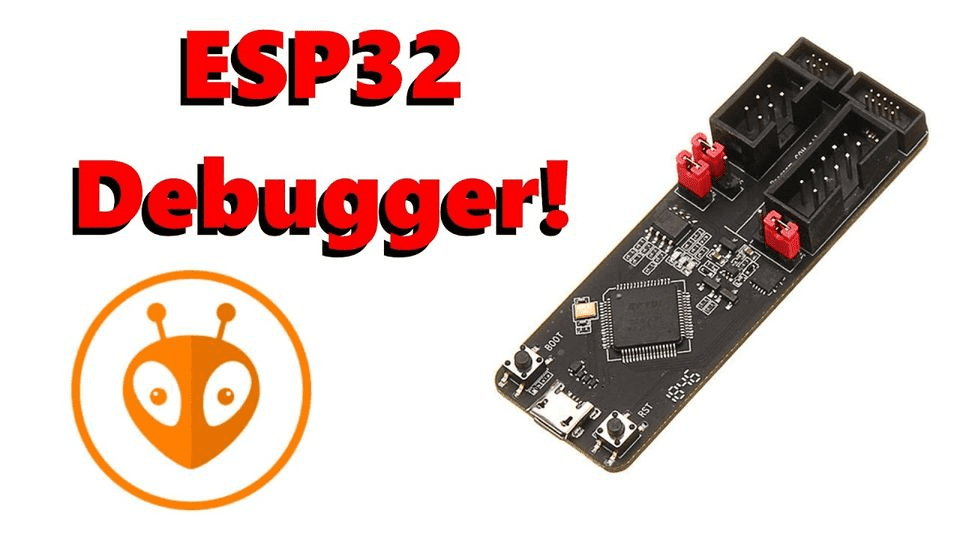
Learning JTAG Debug Skill by using OpenOCD.
GDB, JTAG, OpenOCD basic knowledge
Setup GDB JTAG Debug for ESP32
Use GDB to debug ESP32 software
JTAG GDB debug skills.
This course focus on how to use GDB to implement the JTAG debug for ESP32 firmware software through OpenOCD.
We will learn the JTAG debug skill for the following GDB commands:
1. Break command: learn how to add break point at different positions of the code, how to check the break point information, delete break point and set the temporary break point
2. Watch command: learn how to watch the value for different types of variables, such as, integer, pointer and expression
3. Next, Step, Until command Learn how to debug the code step by step
4. Print command learn how to print out data value for the integer, array, string, struct and variables in different functions and files, also included how to set data with different values by print command
5. Display command learn how the display command automatically show the variables' value
6. Examine command: learn how to show variables' value according the memory address
7. Ptype, whatis command: learn how to show the type of the variables
8. Backtrace, where, frame command: learn how to trace the code by the stack information
9. Jump command learn how to ignore code, repeat code and run branch code by the jump command
10. Set command: learn how to set "code" variable value and how to set "environment" variable value
11. Define command learn how to create a new "command" by using define command
You do not have permission to view the full content of this post. Log in or register now.
Attachments
-
You do not have permission to view the full content of this post. Log in or register now.